Get started with Zealy Analytics
Easily track and analyze your community's performance with Zealy Analytics.
Overview
The Analytics section offers a detailed view of your community's performance. It allows you to track essential metrics, oversee user engagement, and understand your community's growth across various platforms.
Community
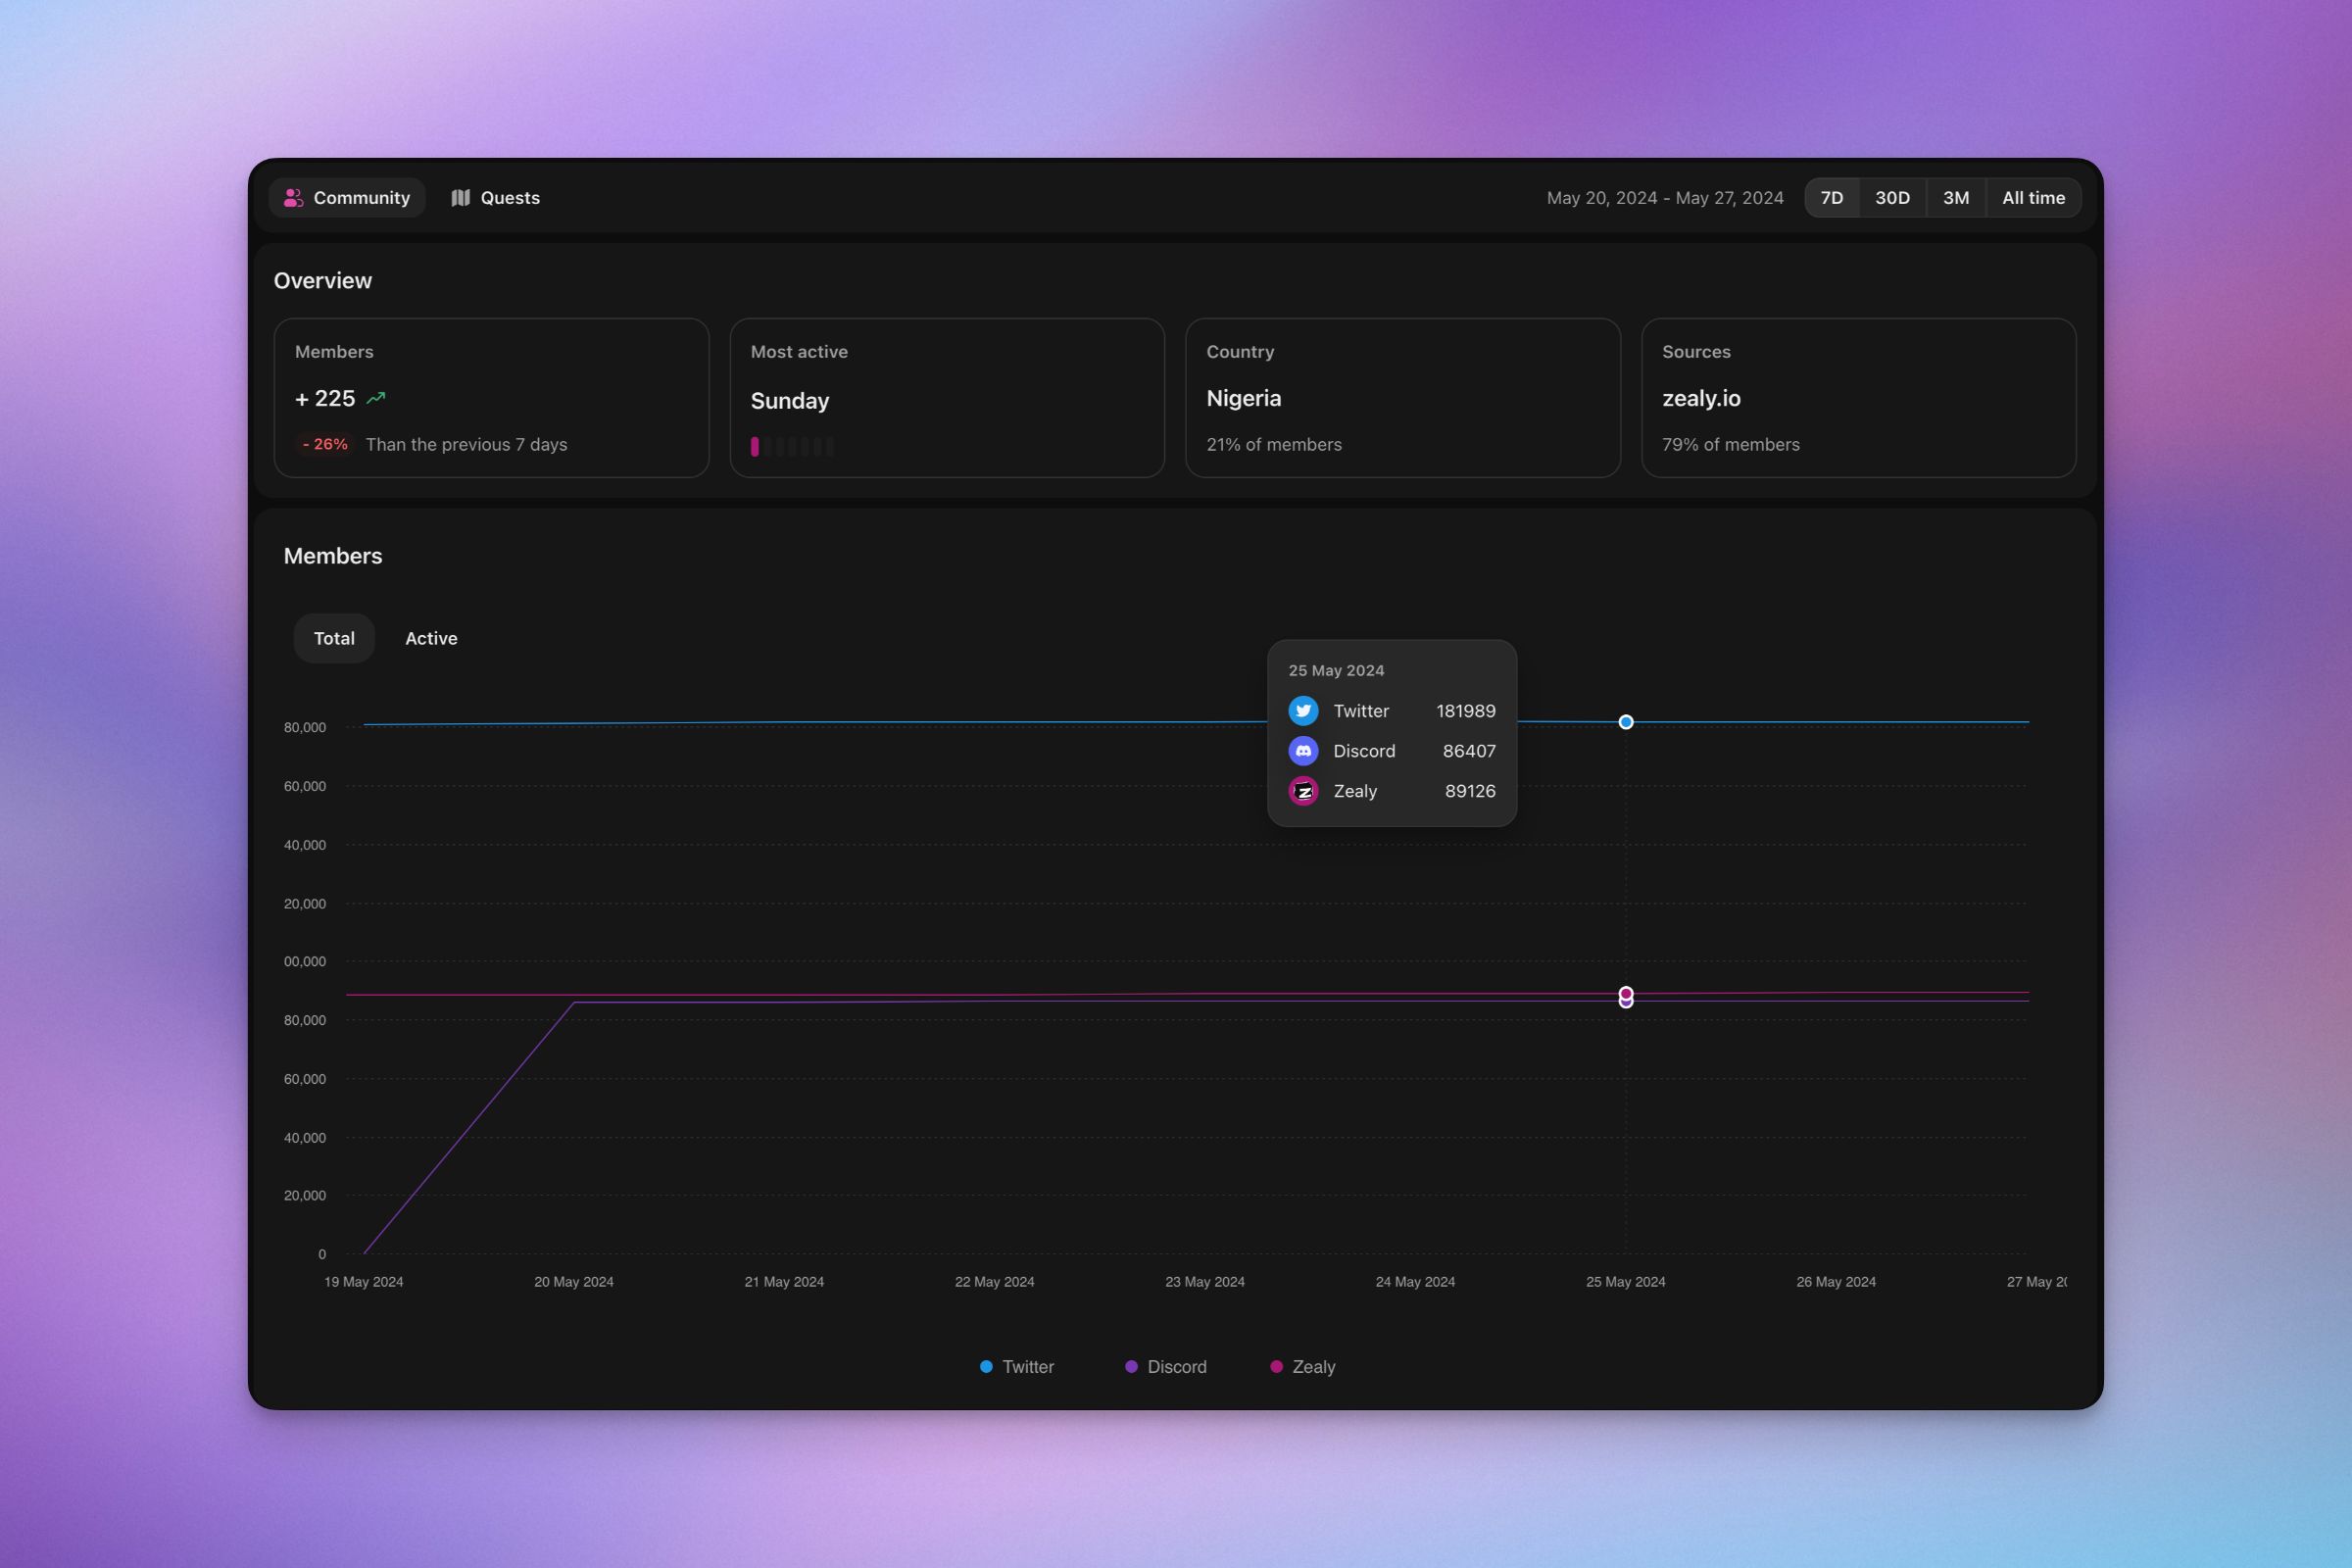
This tab provides an overview of your community's health on Zealy and other connected platforms.
Members
The Members graph displays the community member count over time. It lets you filter by date range and view the number of active members and members on Zealy, Twitter, and Discord.
Top Countries
This feature shows the countries your members are from and the number of members in each country.
Top Sources
Here you can see where your members originate from and the number of members from each source. This data can help you assess the effectiveness of various marketing strategies.
Top Communities
This feature displays the other communities your members are part of and the member count in each. This information can help you understand where your members spend their time and identify potential partnerships.
Quests
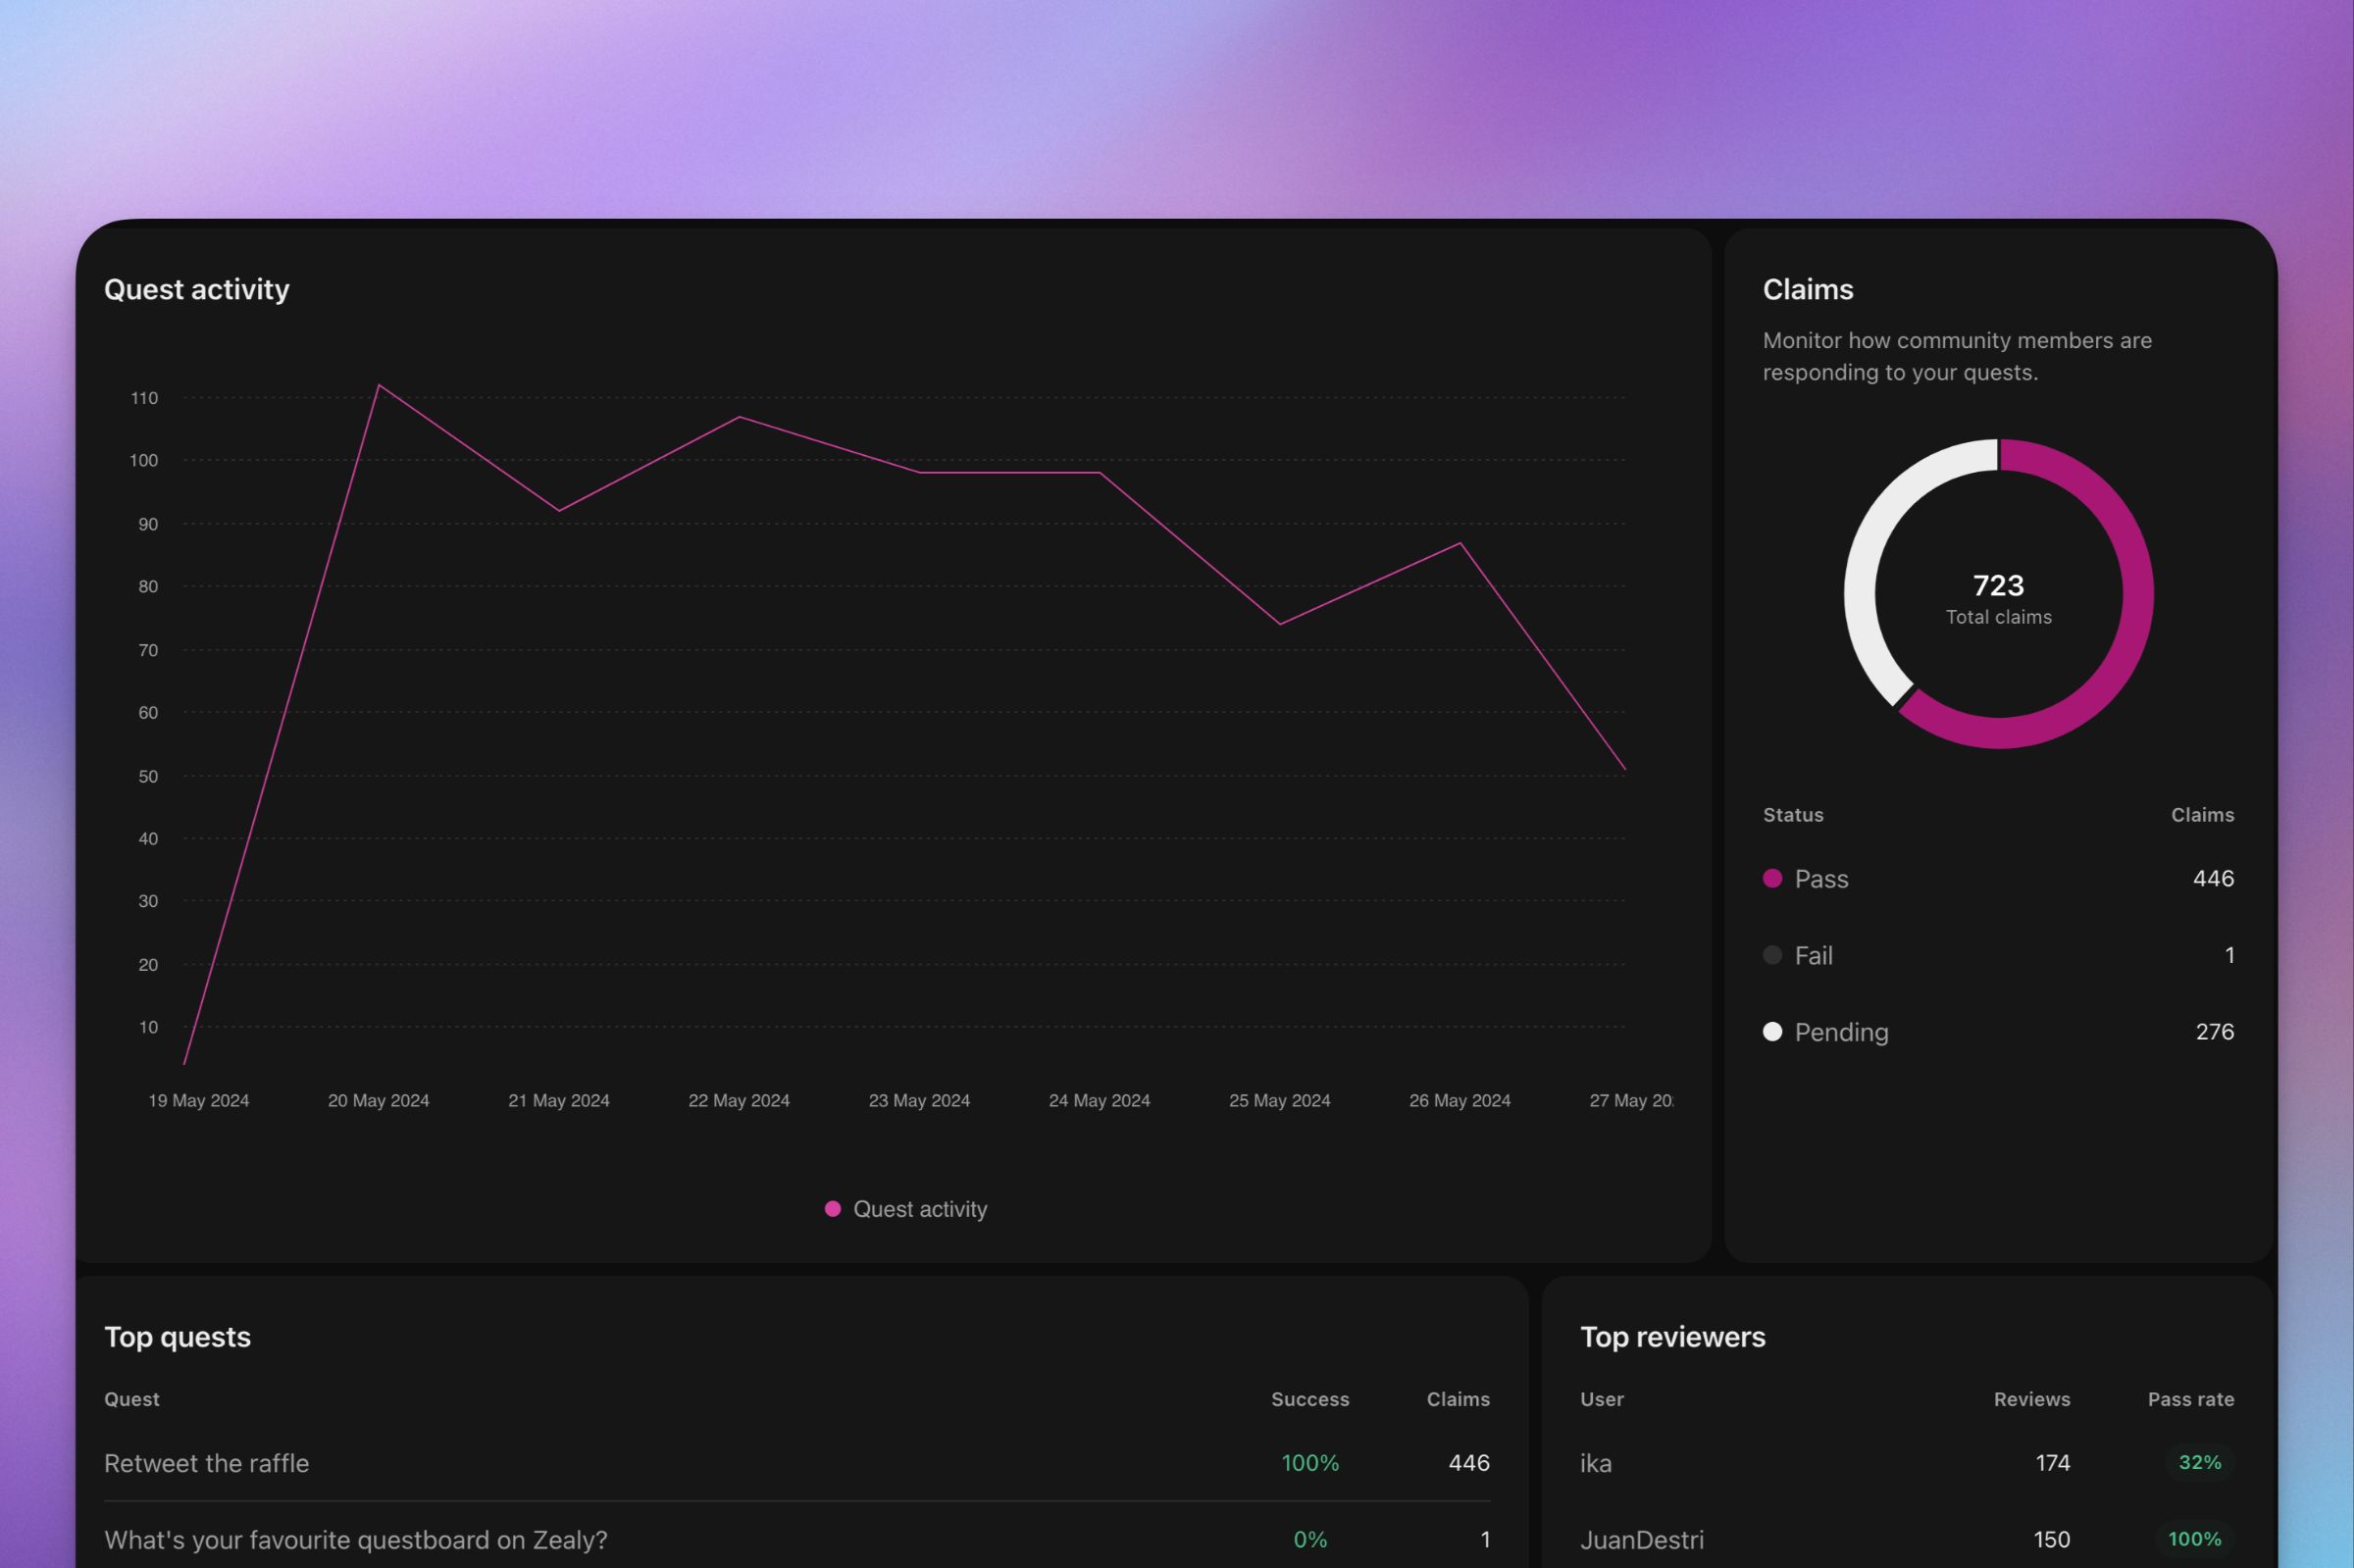
The Quests tab provides information on your quests' performance.
Quest Activity
This feature allows you to monitor how quest claims are distributed over time.
Top Quests
Here you can see which quests are the most popular and the success rate of each quest. This information can help identify potential obstacles or determine which quests are most engaging.
Top Reviewers
This feature shows your most active reviewers and their success rates. This information can help you determine if some reviewers are more stringent than others.
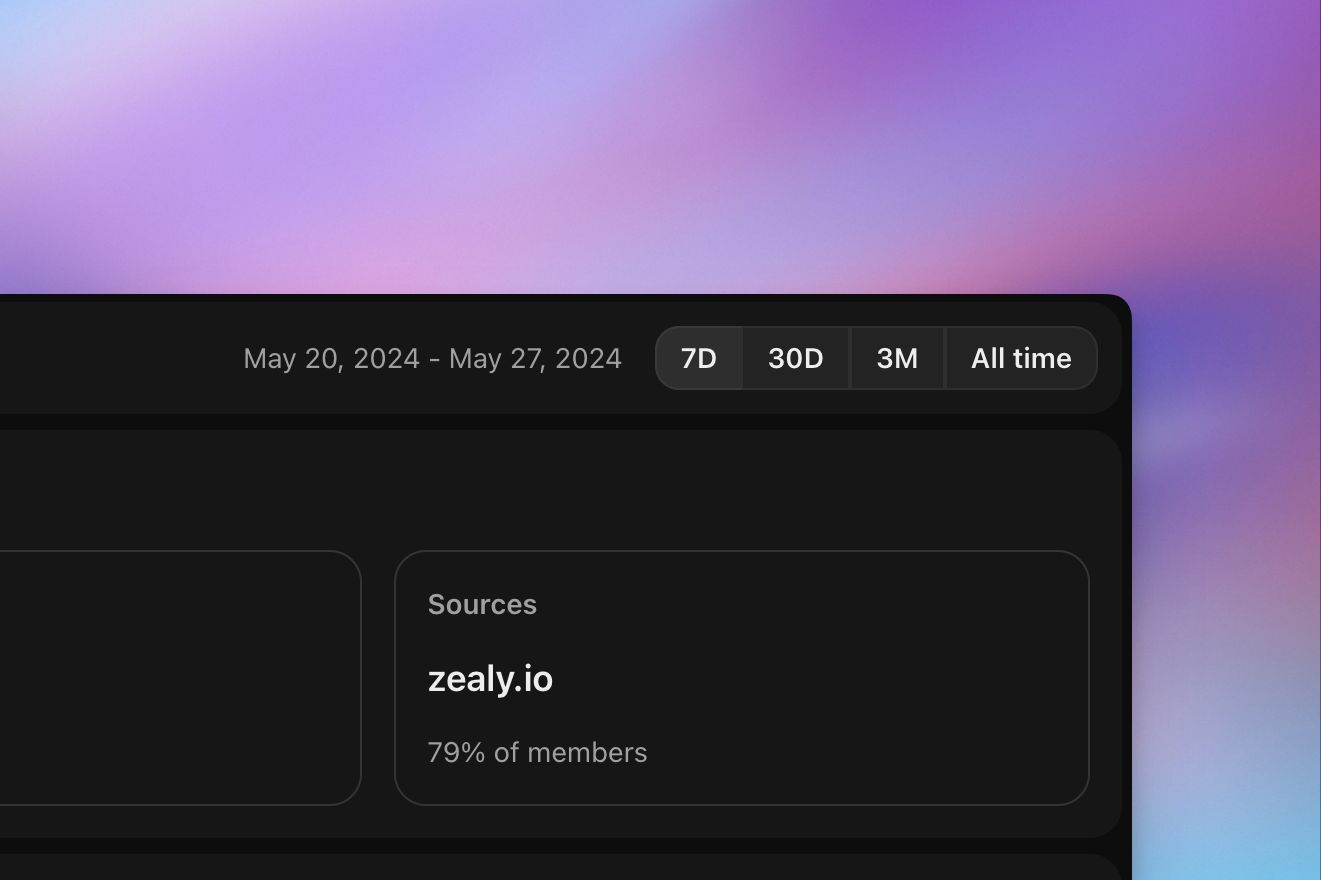
Time Frame
In the top right corner, you can select the time frame for your analysis. Options include the last 7 days, last 30 days, last 90 days, or all time. Your selection will apply to all graphs in the Analytics section.